
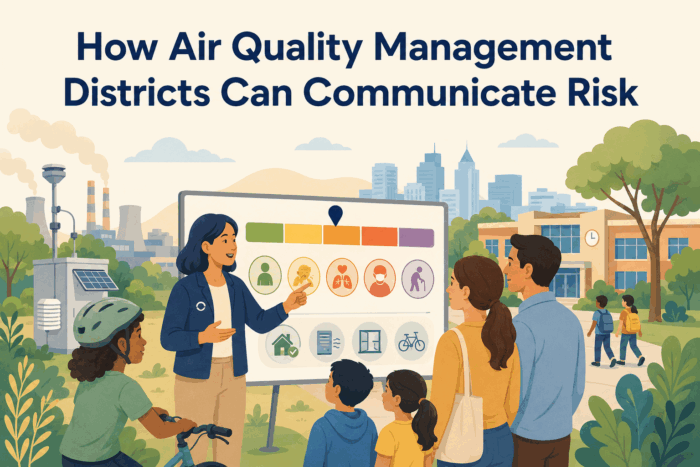
Translating Air Quality Monitoring Data for Public Understanding: How Air Quality Management Districts Can Communicate Risk
Air quality monitoring data can appear highly objective because it is presented through measurements, charts, indices, maps, pollutant concentrations, and time-based trends. Yet the public interpretation of those data is rarely straightforward. Residents may see a number increase and assume immediate danger, see a low daily reading and conclude that broader air quality concerns are unfounded, or compare measurements from different monitors without understanding that location, pollutant type, averaging period, weather, and monitoring purpose can all affect what the numbers mean.
Air quality management districts therefore face a communication challenge that is different from simply publishing data. They must help people understand what was measured, where the measurement was taken, what time period it represents, which health or regulatory framework is relevant, and what conclusions can and cannot reasonably be drawn from the result. Without that context, technically accurate information can still produce misunderstanding, unnecessary alarm, or false reassurance.
The challenge becomes more significant in communities that already have concerns about nearby industrial activity, traffic corridors, wildfire smoke, cumulative pollution, or historical environmental burdens. Residents may use monitoring data as evidence in broader debates about health, permitting, enforcement, land use, or environmental justice. Air quality management districts should neither dismiss those interpretations nor allow a single dataset to carry more meaning than the monitoring program was designed to support.
Effective risk communication begins by treating air quality data as information that requires interpretation, not as self-explanatory evidence. Districts should explain the purpose of monitoring, distinguish short-term conditions from long-term patterns, clarify the difference between ambient measurements and source-specific emissions, and connect numerical results to appropriate health or regulatory context. The objective is to make data understandable without overstating certainty or reducing complex air quality conditions to a single number.
Explain What the Monitor Is Measuring Before Explaining Whether the Number Is High or Low
 Public communication should begin with the pollutant or parameter being measured. Particulate matter, ozone, nitrogen dioxide, sulfur dioxide, carbon monoxide, toxic air contaminants, and other monitored pollutants have different sources, behaviors, health implications, and regulatory frameworks. A number has little meaning if the audience does not first understand what substance or condition it represents.
Air quality management districts should identify the pollutant in plain language and explain why it is monitored. The communication should distinguish whether the monitoring supports regulatory compliance, regional air quality assessment, public health advisories, source investigation, community monitoring, trend analysis, or another purpose. Different monitoring programs may generate data that are useful for different questions.
The unit of measurement also matters. Concentrations reported in parts per billion, parts per million, or micrograms per cubic meter can be difficult for nontechnical audiences to interpret. Districts do not need to teach atmospheric chemistry, but they should explain what the number represents and connect it to the appropriate benchmark or comparison in a way that avoids implying that one unit is directly comparable with another.
Starting with the measurement itself creates a foundation for later risk communication. Residents are better positioned to understand what a result means when they first know what was measured, why it was measured, and what type of question the monitoring program is designed to answer.
From Fragmentation to Coordination: Communication Strategies for Councils of Governments, Metropolitan Planning Organizations, and Regional Planning Agencies
This case study is part of SCG’s series on communication for councils of governments, metropolitan planning organizations, and regional planning agencies. To learn more and to see the parent article, which links to other content just like this, click the button below.
Distinguish Short-Term Readings From Long-Term Air Quality Patterns
Air quality can change significantly over hours, days, seasons, and years. A monitor may record a temporary increase associated with wildfire smoke, weather conditions, traffic patterns, industrial activity, or another event, while long-term averages may show a different trend. Public communication should make this time dimension visible.
Air quality management districts should explain the averaging period associated with important measurements. An hourly reading, daily average, annual average, and multi-year trend do not answer the same question. A short-term spike may be important for immediate exposure or public health communication without necessarily representing the area’s typical air quality. Conversely, a single low reading does not establish that long-term conditions are consistently favorable.
This distinction becomes particularly important when residents compare today’s conditions with regulatory standards based on different averaging periods. A public-facing explanation should identify whether the relevant threshold or standard applies over an hour, eight hours, twenty-four hours, a year, or another period. Without that context, audiences may make comparisons that are mathematically simple but analytically invalid.
Clear time-scale communication helps districts avoid two common errors: treating a temporary event as proof of a permanent condition and treating a favorable short-term reading as evidence that broader air quality concerns are resolved.
Explain Peaks Without Treating Every Peak as the Same Kind of Risk
A sudden increase in a pollutant can attract immediate attention, especially when residents are watching real-time monitoring dashboards. Air quality management districts should explain that the significance of a peak depends on the pollutant, concentration, duration, location, applicable health guidance, and whether the reading is confirmed or influenced by unusual conditions.
A short-lived increase may be relevant to acute exposure, while another pollutant may be evaluated primarily through longer-term averages. Public communication should avoid describing every elevated reading as an “exceedance” unless it actually exceeds the applicable regulatory or health-based criterion.
Districts should also explain whether the data are preliminary. Real-time systems can provide valuable public information, but some measurements may require validation, quality assurance, or additional review before they are used for formal regulatory conclusions. Making that distinction visible supports transparency without undermining the usefulness of timely data.
Explain Where a Monitor Is Located and Why Location Matters
Monitoring location strongly influences what a measurement can represent. A monitor near a major roadway may reflect different conditions from one placed at a regional background site, near an industrial area, or within a residential neighborhood. Public audiences may assume that a measurement applies uniformly across an entire city or district when the actual representativeness is more limited.
Air quality management districts should explain why a monitoring site was selected and what geographic area or type of condition it is intended to characterize. If a site is designed to capture regional conditions, traffic-related pollution, community exposure, maximum concentrations, or another specific purpose, that information should accompany public-facing data.
Districts should also explain why neighboring monitors can report different values without either being incorrect. Weather, topography, proximity to sources, elevation, wind direction, and local activity can all influence concentrations. A map showing multiple measurements is more useful when audiences understand that spatial variation is expected rather than evidence of inconsistent monitoring.
This context is especially important when communities question whether a monitor is too far from a facility or neighborhood to represent their experience. The agency should explain the purpose and limitations of the existing network while acknowledging when one monitor cannot answer every local exposure question.
Distinguish Ambient Air Quality Measurements From Facility Emissions
One of the most important distinctions in air quality communication is the difference between what a facility emits and what an ambient monitor measures in the surrounding environment. Emissions data describe pollutants released from a source, while ambient monitoring measures pollutant concentrations in the air at a particular location. The two are related, but they are not interchangeable.
Air quality management districts should explain that ambient concentrations can reflect contributions from many sources, including vehicles, industry, regional pollution, wildfire smoke, household activities, and natural conditions depending on the pollutant and location. A high ambient reading does not automatically identify a particular facility as the source unless additional analysis supports that conclusion.
The opposite caution is equally important. A facility may emit a pollutant even when a nearby monitor does not show a dramatic increase. Dispersion, meteorology, monitoring location, timing, and background conditions can affect whether a source contribution is visible in an ambient measurement.
Clear separation between emissions and ambient monitoring protects both scientific accuracy and public trust. Residents can understand that monitoring provides valuable information about environmental conditions while recognizing that source attribution may require additional tools such as emissions inventories, modeling, source testing, wind analysis, or targeted investigation.
Translate Health Benchmarks Without Turning Them Into Absolute Safety Lines
Public audiences often look to standards, guidelines, indices, or health benchmarks for a simple answer about whether air is safe. These tools are useful, but they should not be communicated as universal boundaries between harmless and harmful exposure. Different benchmarks may be designed for different pollutants, populations, exposure periods, or regulatory purposes.
Air quality management districts should explain what benchmark is being used and what question it addresses. A national ambient air quality standard, health advisory level, air quality index category, screening threshold, or risk-based guideline may each have a different role. Public communication should avoid blending these measures into a single concept of “the safe level.”
When a measurement is below an applicable benchmark, districts should state the finding precisely. The appropriate message may be that the concentration did not exceed the relevant standard or health guidance for the period measured. That is more accurate than saying there is no health risk or no pollution.
Similarly, when a measurement exceeds a benchmark, communication should explain what the exceedance means and what response follows. The agency should identify whether the result triggers a public health advisory, regulatory evaluation, additional investigation, or another action rather than leaving audiences to infer the consequence themselves.
Explain What the Data Cannot Tell the Public
Monitoring data are most credible when agencies communicate their limitations as clearly as their findings. A single monitor generally cannot identify every source contributing to a measurement, determine an individual’s exact exposure, predict a specific health outcome, or represent every location within a community.
Air quality management districts should state these boundaries directly when they are relevant. If the data describe outdoor ambient conditions, the agency should not imply that they measure indoor exposure. If the monitor represents one location, the communication should not suggest that every resident experienced the same concentration.
Limitations should not be presented as reasons to disregard the data. Monitoring remains a critical tool for understanding air quality conditions, identifying patterns, supporting regulatory programs, and informing public health communication. The objective is to help audiences understand the strength of the evidence and the questions it is capable of answering.
This balance is especially important during controversy. Transparent communication about limitations can prevent both overstatement by the agency and overinterpretation by outside audiences. It allows monitoring data to remain useful evidence without becoming a substitute for analyses they were never designed to perform.
Explain the Air Quality Index Without Letting It Replace the Underlying Data
The Air Quality Index can be one of the most recognizable tools for public communication because it converts pollutant concentrations into categories associated with health guidance. For many residents, it is the primary way they understand daily air quality conditions. Air quality management districts should use the index as an accessible entry point while making clear that it summarizes specific pollutants and time periods rather than providing a complete picture of every air quality condition in a community.
Public-facing communication should explain which pollutant is driving the reported category and why that matters. Two days may receive the same overall category for different reasons, with one driven by particulate matter and another by ozone. The associated exposure patterns, seasonal conditions, sources, and recommended precautions can differ. Identifying the dominant pollutant helps audiences understand what the index is actually describing.
Districts should also distinguish the index from regulatory compliance determinations. A daily air quality category is designed primarily to communicate current health-related conditions and protective actions. Formal determinations about attainment, violations, permit compliance, or longer-term air quality trends may use different datasets, averaging periods, procedures, and standards.
The index is therefore most useful when it functions as a communication bridge rather than the final interpretation. Residents can quickly understand current conditions while still having access to the underlying measurements, pollutant information, health guidance, and longer-term context when they need greater detail.
Distinguish Real-Time Data From Validated Regulatory Data
Many monitoring systems now allow residents to see measurements shortly after they are collected. Real-time or near-real-time access can be extremely valuable during wildfire smoke events, pollution episodes, unusual odors, or other circumstances when communities want immediate information. At the same time, preliminary data may not have completed the quality-control processes used for formal regulatory analysis.
Air quality management districts should identify clearly when data are preliminary and explain what that status means. A preliminary reading can still be useful for understanding current conditions, but it may later be adjusted, invalidated, or interpreted differently after equipment checks, calibration review, or other quality-assurance procedures. This distinction should be visible on dashboards and in public explanations rather than buried in technical disclaimers.
The agency should also explain why validated datasets may appear later or contain values that differ from the original display. Without that context, residents may interpret revisions as evidence that the district changed inconvenient results or that the monitoring system is unreliable. Clear explanation of routine data validation can prevent normal scientific quality-control practices from becoming a source of mistrust.
Real-time communication should therefore balance timeliness with transparency. The district can provide actionable information quickly while being honest about the status of the measurement and the level of certainty appropriate at that stage.
Explain Sensor Data and Regulatory Monitoring as Different Tools
Low-cost air sensors and community monitoring networks have expanded the amount of local air quality information available to the public. Residents may operate their own devices, schools may host sensors, community organizations may develop neighborhood networks, and commercial platforms may display measurements at far more locations than traditional regulatory monitoring networks. These tools can provide valuable spatial awareness, but they do not necessarily operate under the same methods or quality requirements as regulatory monitors.
Air quality management districts should explain the difference without dismissing community-generated information. Regulatory monitors may follow specific siting, calibration, maintenance, quality-assurance, and data-validation requirements depending on their purpose. Lower-cost sensors may provide useful indications of local conditions while also being more sensitive to humidity, temperature, device performance, placement, or other factors.
The strongest communication explains what each tool can contribute. Sensor networks may identify patterns, highlight areas that deserve closer investigation, support community awareness, or provide more localized information. Regulatory monitors may support formal standards, long-term trends, and official determinations under established monitoring frameworks. These functions can complement one another without being interchangeable.
Districts should also provide guidance when residents compare sensor readings with nearby regulatory monitors. Differences do not automatically mean one device is wrong. Location, technology, averaging, calibration, and local conditions can all affect the comparison. Explaining those differences helps communities use additional monitoring information more constructively.
Respond to Community Data With Evaluation Rather Than Dismissal
Community members may bring sensor data or independent monitoring results to an air quality management district because they believe the information shows a problem that the official network has missed. A response focused only on why the data do not meet regulatory monitoring standards can alienate stakeholders and overlook potentially useful information.
Districts should explain how the information can be evaluated. Staff may be able to assess the device type, location, time pattern, nearby sources, meteorological conditions, or comparison with other monitoring data before drawing conclusions. The appropriate response will depend on the information available and the district’s authority.
This approach preserves scientific standards while recognizing the value of community observation. The district does not need to treat every sensor reading as a regulatory finding, but it should communicate how additional information can contribute to investigation or understanding.
Explain Trends Without Letting Averages Hide Important Variation
Long-term trends are essential for understanding whether air quality is improving, worsening, or remaining relatively stable, but trend communication can become misleading when averages obscure periods or locations of elevated pollution. Air quality management districts should explain both the overall pattern and the variation within it.
An annual or multi-year average can show important progress while certain seasons, neighborhoods, or pollution episodes continue to present concerns. Likewise, one severe event does not necessarily reverse a sustained long-term improvement. Public communication should distinguish these levels rather than selecting whichever timescale produces the most reassuring or alarming narrative.
Districts should also explain whether changes in monitoring networks, methodologies, wildfire activity, weather, regulations, or source patterns affect trend interpretation. A change in measured concentrations may reflect several influences, and communication should avoid attributing the entire trend to one program or source unless the evidence supports that conclusion.
Balanced trend communication allows agencies to acknowledge progress without minimizing remaining problems. Residents are more likely to trust long-term data when the agency shows where conditions have improved and where meaningful variability or persistent concerns remain.
Explain Weather and Atmospheric Conditions as Part of Air Quality Interpretation
Air pollution levels can change substantially even when emissions from major sources remain relatively stable because weather affects how pollutants form, disperse, accumulate, and move. Wind direction, temperature, atmospheric stability, sunlight, precipitation, and seasonal patterns can all influence monitoring results. Public audiences may interpret these changes as direct evidence that a nearby source suddenly emitted more or less pollution.
Air quality management districts should incorporate basic meteorological context when explaining unusual readings or regional pollution episodes. For example, stagnant atmospheric conditions may allow pollutants to accumulate, while stronger winds may disperse them or transport pollution from another area. Some pollutants also form through chemical reactions in the atmosphere rather than being emitted directly in the form measured.
This explanation should not be used to dismiss local sources. Weather can influence the concentration measured from emissions that are still real and regulated. The communication goal is to explain why the relationship between emissions and ambient concentration is not always immediate or linear.
Including weather context can also help residents understand why air quality may vary sharply from one day to the next. It turns monitoring data into a more complete explanation of environmental conditions rather than a sequence of numbers that appear to fluctuate without reason.
Explain Source Attribution Carefully When Communities Want a Specific Cause
When a monitor records elevated pollution, public attention often turns quickly toward identifying the source. Residents may point to a nearby industrial facility, freeway, construction site, wildfire, agricultural activity, or another visible contributor. In some cases, the suspected source may be plausible, but a monitoring result alone may not establish attribution.
Air quality management districts should explain what additional evidence is needed to connect a measurement to a particular source. Wind direction, emissions information, chemical composition, source testing, modeling, temporal patterns, operational records, or additional monitors may be necessary depending on the pollutant and circumstances.
The district should avoid both premature attribution and premature dismissal. Saying that one source definitely caused an elevated reading without sufficient evidence can damage credibility, while immediately asserting that a nearby facility could not be responsible may be equally unsupported. The appropriate communication should distinguish what is known from what remains under investigation.
When attribution becomes clearer, the district should update the public explanation. Showing how the agency moved from observation to investigation to conclusion helps communities understand the evidentiary process and makes later compliance or enforcement actions easier to interpret.
Translate Health Guidance Into Practical Actions Without Creating Unnecessary Alarm
Air quality risk communication is most useful when residents can determine what they should do with the information. A monitoring result or health advisory should therefore connect the measured condition to practical protective guidance appropriate to the pollutant and level of concern.
Air quality management districts should identify which groups may be more sensitive when relevant and explain what actions are recommended. Guidance may involve reducing strenuous outdoor activity, moving activities indoors, using available air filtration, following public health recommendations, or taking other protective steps depending on the event and authoritative health guidance. The district should avoid inventing generalized precautions when the applicable health recommendation is more specific.
Communication should also distinguish precaution from evidence of individual harm. Advising sensitive individuals to limit exposure does not mean every person exposed will experience a health effect. Conversely, describing a recommendation as precautionary should not minimize the reason the guidance exists.
Practical risk communication gives residents a sense of agency without making them responsible for solving the underlying air quality problem. The district’s role remains broader, including monitoring, regulation, investigation, permitting, enforcement, and coordination with public health partners where applicable.
Organize Monitoring Communication Around the Questions Residents Need Answered
Air quality management districts often present monitoring data through technical dashboards, pollutant tables, station summaries, and regulatory reports. Those tools are useful for specialists, but public audiences usually approach the information through more practical questions. They want to know what the current conditions mean, whether the air is unusual for the area, whether a nearby source may be contributing, whether sensitive people should take precautions, and whether the district is investigating anything that appears concerning.
Districts should organize public-facing communication around these questions while preserving access to the underlying data. A resident should be able to move from a simple explanation of current conditions into more detailed information about the pollutant, monitoring location, averaging period, historical pattern, and applicable health or regulatory benchmark. This layered approach makes the data easier to use without reducing it to a single simplified conclusion.
Question-based communication is especially valuable during unusual events. When particulate matter rises suddenly, ozone reaches elevated levels, or a community monitor shows a pattern residents have not seen before, the district should anticipate the questions most likely to follow and answer them directly. This can reduce the spread of unsupported assumptions while giving residents a clear path toward more detailed technical information.
The objective is not to substitute public questions for scientific interpretation. It is to make the district’s scientific interpretation easier to follow by organizing it around the decisions and concerns that matter to the people using the data.
Explain Risk as a Combination of Concentration, Duration, Exposure, and Sensitivity
 Public audiences often interpret air quality risk through the concentration number alone. A higher number appears more dangerous and a lower number appears safer, but actual risk communication usually requires more context. Exposure duration, frequency, pollutant characteristics, individual sensitivity, location, and other factors can all influence how a measured concentration should be understood.
Air quality management districts should explain that the meaning of a reading depends partly on how long the condition lasts and who is exposed. A short-term elevation may be important for acute effects, while another pollutant may be more relevant when exposure persists over longer periods. The applicable health guidance or regulatory benchmark should determine how the district frames the result.
This distinction is also important for sensitive populations. Children, older adults, people with certain health conditions, outdoor workers, and others may receive different precautionary guidance under recognized public health frameworks. Districts should communicate those recommendations accurately without implying that every person in a category will experience the same effect.
Risk communication becomes more credible when the agency explains these components rather than treating one monitoring value as a complete description of health risk. Residents gain a more realistic understanding of why the same concentration may have different implications depending on pollutant, duration, and exposure circumstances.
Use Comparisons Carefully When Helping the Public Interpret Data
Comparisons can make unfamiliar air quality measurements easier to understand, but they can also mislead when the underlying conditions are not equivalent. Residents may compare one neighborhood with another, current readings with last year, a community sensor with a regulatory monitor, or one pollutant concentration with a different health benchmark. Air quality management districts should help audiences understand which comparisons are meaningful and which require caution.
A useful comparison should preserve key analytical similarities, such as pollutant, averaging period, monitoring method, and relevant location. Comparing the same pollutant at the same site over several years can help show a trend. Comparing two stations may also be informative when the district explains differences in siting and local conditions. By contrast, comparing values collected through different instruments or time periods without context can create false conclusions.
Districts should also be cautious with dramatic historical comparisons. A current pollution episode may be significantly higher than normal but still differ from a previous event in pollutant composition, duration, or geographic extent. Public communication should identify those distinctions rather than relying on a simple ranking of which event was “worse.”
Comparative communication is most useful when it answers a defined question. Districts should explain what the comparison demonstrates and what it does not, helping residents interpret relative conditions without turning every difference into a conclusion about risk or source responsibility.
Explain Why Two Nearby Monitors Can Tell Different but Valid Stories
Residents may expect monitors located within the same community to produce nearly identical readings. When they do not, people may suspect equipment failure or selective reporting. In reality, local pollution can vary substantially across relatively short distances depending on traffic, industrial activity, terrain, wind, elevation, and other factors.
Air quality management districts should explain that different monitoring sites can represent different exposure environments or monitoring objectives. A roadside monitor may intentionally capture traffic influence, while another site may be intended to characterize broader neighborhood conditions.
The important question is not simply which monitor has the higher value. It is what each site was designed to measure and how the measurements together contribute to a more complete understanding of local air quality.
Show Long-Term Trends Without Minimizing Persistent Community Concerns
Air quality management districts may have strong evidence that concentrations of certain pollutants have declined over years or decades. Communicating that progress is important, but districts should avoid presenting broad improvement as though it resolves every local concern. Regional trends and neighborhood-level experience can differ substantially.
A district can accurately explain that a pollutant has declined across the monitoring network while also identifying locations, seasons, or episodes where elevated conditions persist. This balanced framing recognizes regulatory and technological progress without implying that all communities experience the same improvement.
Long-term communication should also explain which factors contributed to observed changes when the evidence supports those conclusions. Emission controls, cleaner vehicles, industrial changes, fuel standards, weather patterns, wildfire activity, economic shifts, or other influences may affect trends. Districts should avoid attributing an entire improvement to one program unless the analytical record supports that claim.
This approach is especially important in communities with longstanding environmental concerns. Residents are more likely to trust trend communication when the district can acknowledge both measurable progress and the conditions that remain unresolved.
Communicate Unusual Monitoring Results Before Speculation Fills the Information Gap
Unexpected or elevated monitoring results can attract rapid public attention, particularly when data are available through real-time dashboards. If the district does not provide context quickly, residents, media outlets, or social networks may begin assigning causes or health implications before the agency has enough information to make those conclusions.
Air quality management districts should have a communication approach for unusual readings that distinguishes observation from interpretation. An initial update can confirm that the district is aware of the result, identify the pollutant and monitoring location, explain whether the data are preliminary, and describe what additional review is underway.
The agency should avoid delaying all communication until the cause is known. Silence can create the impression that the district is unaware of the issue or withholding information. At the same time, early communication should not speculate about a facility, incident, or health effect that has not been established.
Follow-up matters as much as the initial notice. If quality assurance confirms the reading, additional investigation identifies a likely cause, or the result is invalidated because of equipment issues, the district should update the public record clearly. This creates a visible progression from detection to evaluation to conclusion.
Explain Investigations as a Process Rather Than an Immediate Source Determination
When monitoring data raise concerns, residents may expect the district to identify the source immediately. Source investigation, however, can require comparison with meteorological data, facility operations, emissions information, other monitors, chemical signatures, inspection findings, or additional sampling. The time needed to evaluate those factors should be explained.
Air quality management districts can outline the types of information being reviewed without prematurely identifying a responsible source. This helps the public understand that the district is taking the result seriously while preserving scientific and procedural accuracy.
If several potential contributors exist, the district should say so rather than reducing the investigation to the most visible nearby facility. Conversely, if evidence increasingly points toward a specific source, communication should evolve as the factual basis becomes stronger.
This process-based explanation is valuable because it shows how regulatory agencies move from raw monitoring data toward a supportable conclusion. Residents can see that source attribution is evidence-driven rather than intuitive or politically determined.
Pair Data Dashboards With Interpretive Guidance
Real-time dashboards can provide transparency, but they can also leave residents to interpret complex data independently. Air quality management districts should treat dashboards as one component of a broader communication system rather than as a substitute for explanation.
Dashboards should make pollutant names, units, monitoring locations, timestamps, data status, and relevant health guidance easy to identify. Users should be able to distinguish preliminary readings from validated data and understand when values represent hourly, daily, or other averaging periods.
Interpretive content should also help users navigate unusual conditions. Short explanations of common pollutants, monitoring purposes, health categories, and data limitations can reduce confusion without cluttering the interface. Where a reading is receiving unusual attention, a linked district update can provide more context than the numerical display alone.
A well-designed dashboard supports transparency by giving users both access and orientation. The goal is not merely to place measurements online, but to help the public understand what those measurements can reasonably tell them about current air quality conditions and risk.
Integrate Monitoring Communication Into Routine Program Operations
Air quality monitoring communication is most effective when it is treated as part of routine program management rather than reserved for unusual events or public controversy. Air quality management districts should identify when monitoring data need explanation, which audiences are most likely to use them, and how staff will maintain consistency across dashboards, public advisories, technical reports, media responses, and community meetings.
Program planning should also identify which conditions trigger additional communication. A sustained increase, unusual short-term peak, monitor outage, data correction, new monitoring site, changed methodology, or wildfire-related episode may require more than simply updating a numerical display. The public should understand what changed, whether the data remain comparable, and what additional interpretation is appropriate.
Internal responsibilities should be clear as well. Monitoring staff, public information officers, toxicologists, technical specialists, enforcement personnel, and community engagement teams may all communicate about the same data. A shared process for confirming facts, identifying uncertainty, and approving public-facing explanations helps prevent different parts of the district from interpreting the same result in inconsistent ways.
Integrating these responsibilities into program operations makes communication more reliable over time. Residents receive continuity rather than isolated explanations that appear only after a monitoring result becomes controversial.
Establish Clear Review Standards for Public-Facing Data Explanations
Air quality data can move quickly from technical systems into public discussion, particularly when dashboards update in real time. Districts need a practical review process that preserves scientific accuracy without delaying communication until every possible interpretation has been resolved.
Air quality management districts should define which information can be communicated immediately and which conclusions require additional technical review. Staff may be able to confirm that a monitor recorded an elevated value and that the reading is preliminary while withholding any statement about source attribution until additional evidence is available. This distinction allows timely communication without sacrificing scientific discipline.
Review standards should also identify when health or risk language requires coordination with toxicologists, epidemiologists, public health partners, or other qualified specialists. Communications staff should not be expected to translate a complex health implication independently when the meaning depends on pollutant-specific science or exposure assumptions.
A clear review structure improves both speed and precision. Staff know what they can say, what needs confirmation, and where technical uncertainty should remain visible instead of being simplified away for the sake of a faster public response.
Create Consistent Interpretation Across Dashboards, Reports, and Public Statements
Public confidence can erode when the same air quality condition is described differently across agency channels. A dashboard may show an elevated reading, a technical report may characterize the value in regulatory terms, and a spokesperson may use broader language about health risk. Even when each statement is defensible in isolation, the overall message can appear contradictory.
Air quality management districts should align the terminology used across major communication channels. Pollutant names, averaging periods, data status, monitoring locations, applicable benchmarks, and risk descriptions should remain consistent unless a different explanation is necessary for a specific audience. When terminology changes between technical and public-facing materials, the underlying meaning should remain the same.
Agencies should also maintain consistency when conditions evolve. If an initial reading is preliminary and later validated, the public record should make that progression clear. If a preliminary interpretation changes because additional evidence becomes available, the district should explain why rather than simply replacing the earlier explanation.
Consistency does not require identical wording. It requires that a resident moving from the dashboard to a fact sheet, media statement, or technical report encounter the same basic interpretation of what the data show and what they do not establish.
Preserve the Distinction Between Data Status and Risk Status
A preliminary data label describes the status of the measurement, not necessarily the seriousness of the underlying condition. Likewise, validated data confirm that the measurement has passed appropriate review but do not by themselves determine the health significance of the result.
Air quality management districts should keep these concepts separate. A preliminary reading can still justify precautionary public communication when authoritative guidance supports it, while a validated measurement may still require additional analysis before source attribution or long-term risk conclusions are appropriate.
This distinction helps prevent the public from interpreting “preliminary” as meaning unimportant or “validated” as meaning dangerous. Each term should communicate only what it actually establishes.
Build Communication Protocols for Monitor Outages and Data Gaps
Missing data can become a public trust issue, particularly when a monitor stops reporting during a wildfire event, pollution episode, or period of heightened community concern. Residents may assume the agency is withholding information when the cause is actually equipment failure, calibration, maintenance, communications problems, or another technical issue.
Air quality management districts should communicate outages promptly when the missing data are likely to matter to public understanding. The update should explain which monitor is affected, when the interruption began, whether the cause is known, and what other information sources remain available. Agencies should avoid providing a repair timeline unless it is sufficiently reliable.
Districts should also explain whether nearby monitors, regional estimates, or other tools can provide partial context during the gap. Those sources should not be presented as perfect substitutes if they do not represent the same location or monitoring purpose.
When service resumes, the district should close the communication loop. A brief explanation of restoration, any data recovery, and whether the outage affected formal reporting helps demonstrate that missing information was managed transparently rather than ignored.
Coordinate Monitoring Communication With Public Health Partners
Air quality management districts may collect and interpret environmental data, while public health agencies or other health authorities may provide guidance about protective actions, sensitive populations, or exposure concerns. When those functions intersect, residents should receive coordinated information rather than separate messages that appear to conflict.
Districts should establish how monitoring findings will be shared with health partners when conditions warrant additional guidance. The air district can explain the pollutant, concentration, location, and monitoring context, while public health partners can provide recommendations that fall within their expertise and authority.
Public communication should preserve these roles. The district should not overstate health conclusions beyond the available evidence, and health agencies should have access to enough environmental context to ground their recommendations appropriately. Coordinated messaging is especially important during wildfire smoke events, unusual pollution episodes, or community concerns involving potentially sensitive populations.
Clear role definition also helps residents know where to turn. The air quality district remains the authoritative source for monitoring information, while health partners can provide specialized guidance about personal protective actions and health concerns.
Prepare Communication Systems for High-Visibility Monitoring Events
Some monitoring events attract intense attention because the readings are unusually high, the location is near a sensitive community, the suspected source is controversial, or the data circulate widely through social media before the district has completed its review. Air quality management districts should prepare communication protocols before these events occur.
Preparation can include designated spokespersons, rapid technical review procedures, initial holding language, community notification pathways, multilingual communication, media materials, and coordination with public health or emergency partners. The objective is not to prewrite conclusions, but to ensure that the district can explain what is known and what remains under investigation without delay.
High-visibility events also require careful sequencing. An initial statement may focus on the measurement and data status, followed by additional updates about health guidance, source investigation, or regulatory response as evidence develops. Trying to answer every question in the first communication can increase the risk of premature conclusions.
A prepared system helps the district remain factual under pressure. It also reduces the likelihood that different staff members make inconsistent statements while the monitoring event is still evolving.
Measure Whether Monitoring Communication Is Improving Public Understanding
Air quality management districts should evaluate whether public communication helps residents interpret monitoring data more accurately, not simply whether dashboards and reports are widely available. Access is essential, but it does not demonstrate that people understand what the measurements mean.
Useful indicators may include recurring questions about pollutant units, confusion between sensor and regulatory data, misunderstanding of preliminary readings, repeated source-attribution assumptions, or uncertainty about the difference between short-term and long-term risk. These patterns can show where the agency’s explanatory materials need more context.
Districts can also examine whether residents are better able to identify appropriate protective actions, distinguish current conditions from longer-term trends, and understand when a monitoring result requires additional investigation. Feedback from community organizations and public health partners can provide additional insight into whether the information is usable outside the agency.
The purpose of measurement is continuous improvement. If the same misunderstandings appear across multiple monitoring events, the district should improve its dashboards, terminology, staff guidance, risk explainers, and public education rather than treating each episode as a separate communication problem.
Build Institutional Knowledge That Supports Consistent Risk Communication
Air quality monitoring programs are long-term systems, while staff assignments, technology, monitoring networks, and public concerns can change significantly over time. Districts should preserve communication practices so that interpretation does not depend entirely on the experience of individual employees.
Institutional resources can include approved pollutant explanations, data-status terminology, monitor-location descriptions, health benchmark guidance, source-attribution protocols, outage communication templates, event-response procedures, and lessons from previous high-interest monitoring episodes. These materials should be reviewed periodically so they remain aligned with current science and regulatory practice.
Districts should also document recurring community concerns associated with particular monitoring locations or pollutants. That history can help new staff understand why certain readings generate heightened attention and what additional context audiences may need.
Strong institutional knowledge makes risk communication more consistent and resilient. It helps air quality management districts maintain scientific precision, public accessibility, and continuity even as monitoring technology and staffing evolve.
Strategic Communication Support for Air Quality Monitoring and Risk Communication
 Air quality management districts often have strong technical expertise in monitoring, atmospheric science, emissions analysis, toxicology, data validation, enforcement, and regulatory interpretation, but translating that information for public audiences requires a different communication skill set. Monitoring data can become especially difficult to explain when real-time dashboards, community sensors, wildfire smoke, unusual readings, health concerns, or source-attribution questions generate rapid public attention. External strategic communication support can help districts organize technical findings into clear public information without weakening scientific precision or overstating what the data can establish.
Stegmeier Consulting Group (SCG) can support air quality management districts by developing plain-language monitoring explainers, dashboard content, pollutant and health-risk guidance, public FAQs, community meeting materials, staff talking points, multilingual outreach, monitoring-event updates, public health coordination materials, and communication frameworks for unusual or high-interest readings. SCG can also help districts organize complex information around the questions residents are most likely to ask, distinguish preliminary from validated data, clarify the relationship between regulatory monitors and community sensors, and build consistent explanations across technical reports, webpages, media responses, and public meetings.
External support can be particularly valuable when internal capacity is limited, when monitoring events create rapid communication demands, or when an objective outside perspective can identify where technically accurate explanations remain difficult for nontechnical audiences to interpret. SCG’s role remains focused on communication strategy, information organization, stakeholder engagement, and public-facing content. SCG does not validate monitoring data, conduct air quality modeling, perform toxicological or health risk analysis, determine regulatory compliance, attribute emissions to specific sources, or make enforcement decisions on behalf of the district.
Future Trends
Air quality monitoring will continue becoming more visible, localized, and immediate. Regulatory networks are increasingly supplemented by community sensors, mobile monitoring, neighborhood-scale studies, satellite observations, and other technologies that can provide audiences with far more information than traditional monitoring systems alone. Greater access will improve transparency, but it will also increase the need for clear explanations of data quality, comparability, representativeness, and analytical purpose.
Public expectations are also likely to shift toward more localized interpretation. Residents may increasingly ask not only what regional air quality looks like, but what conditions mean for a particular neighborhood, school, workplace, or corridor. Air quality management districts will need to communicate where available data can support those conclusions and where local exposure questions require additional monitoring or analysis.
Digital platforms may become more interactive, allowing users to explore historical trends, compare monitoring locations, view pollutant-specific conditions, and receive customized alerts. These tools can improve usability, but they can also encourage comparisons that are scientifically inappropriate if averaging periods, monitoring methods, or site purposes differ. Districts will need interpretive guidance alongside increasingly sophisticated data access.
The central communication requirement will remain scientific judgment. More measurements do not automatically create more understanding. Air quality management districts will continue to need clear systems for explaining what data show, what remains uncertain, when precaution is appropriate, and when additional evidence is required before health, source, or regulatory conclusions can be made.
Conclusion
Air quality monitoring data are valuable because they provide evidence about environmental conditions, but the numbers are not self-explanatory. Residents need context about the pollutant, monitoring location, averaging period, data status, applicable health guidance, and purpose of the monitoring program before they can interpret what a reading means.
Effective communication also requires clear distinctions. Ambient concentrations are not the same as source emissions. Real-time data are not necessarily the same as validated regulatory data. A temporary peak is not automatically a long-term trend, and a value below a benchmark does not mean that pollution or risk is absent. Preserving these distinctions helps districts communicate risk without creating either unnecessary alarm or false reassurance.
The strongest monitoring communication systems also explain uncertainty and limitations openly. They show residents why monitors at different locations may produce different readings, why source attribution can require additional evidence, how weather affects concentrations, and why community sensor data can be useful without always serving the same regulatory purpose as official monitors. This context strengthens public understanding rather than diminishing the value of monitoring.
Air quality management districts that treat monitoring communication as part of their broader regulatory and public service infrastructure are better positioned to help communities interpret complex conditions, respond appropriately to unusual events, and understand how monitoring connects to investigation, public health guidance, permitting, and enforcement. Clear communication allows the data to support informed public understanding without asking the numbers to prove more than they actually can.
Stegmeier Consulting Group’s Strategic Approach to Communication Systems
Turn complex monitoring data into understandable risk information without overstating what the evidence can prove.
Air quality management districts need communication systems that help residents understand what monitoring data measure, how short-term readings relate to longer-term conditions, when health guidance applies, and why source attribution or regulatory conclusions may require additional evidence. Stegmeier Consulting Group (SCG) helps districts organize complex monitoring information, develop plain-language risk explanations, strengthen dashboard and public-facing content, align staff messaging, and prepare communication for unusual or high-interest air quality events.
Use the form below to connect with our team and explore how strategic communication support can strengthen air quality monitoring communication and public understanding.