
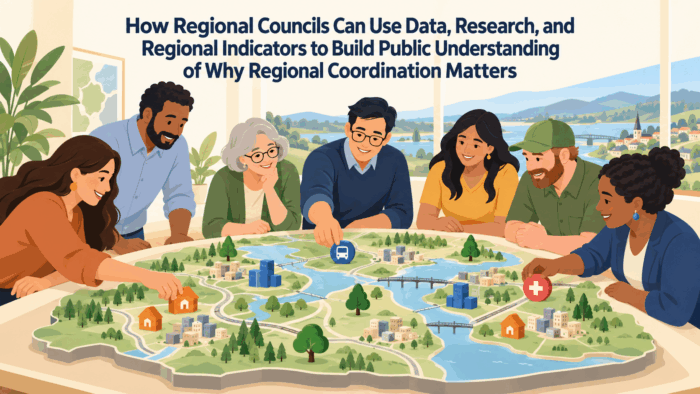
How Regional Councils Can Use Data, Research, and Regional Indicators to Build Public Understanding of Why Regional Coordination Matters
Data and research are among the most powerful tools available to regional collaborative agencies for building public understanding of why regional coordination matters, because they provide the empirical foundation for the regional governance rationale that assertion and advocacy alone cannot establish. The resident who is skeptical that regional transportation planning serves their community’s interests can be shown the transportation demand model that demonstrates why their commute conditions are shaped by development decisions in neighboring jurisdictions that no single local government can address on its own. The elected official who questions whether regional coordination adds value that local governments cannot provide independently can be shown the cost comparison between regional shared services and equivalent independent local service provision. The community member who doubts that regional environmental planning is necessary can be shown the watershed data that demonstrates how upstream land use decisions affect downstream water quality in ways that require regional rather than local regulatory approaches.
But data and research are only as effective as the communication that makes them accessible to the audiences whose understanding they are meant to build. Most regional collaborative agencies produce significant amounts of regional data and regional research, including travel demand models, demographic analyses, environmental monitoring data, and economic development indicators, that are technically available to the public and that contain the empirical basis for understanding why regional coordination matters. Most of that data and research is communicated in technical formats, through technical channels, at levels of analytical detail that planning professionals can use but that general public and elected official audiences cannot access without significant barriers of format, language, and analytical prerequisite knowledge that the technical communication does not provide.
The communication challenge for regional data and research is not to simplify the data to the point of distortion but to translate it to the point of accessibility without losing the analytical integrity that makes the data meaningful. A regional travel demand model result that is communicated to a general audience in terms of how many additional minutes of daily commute a specific development decision will add to the commutes of residents in specific neighborhoods, is a data communication that is both analytically sound and publicly accessible. The same result communicated as a vehicle miles traveled elasticity coefficient is analytically sound and publicly inaccessible. The translation is not simplification. It is the communication discipline of connecting the technical finding to the human consequence that makes the finding publicly meaningful.
This article examines how regional councils can use data, research, and regional indicators to build public understanding of why regional coordination matters, including how to select the indicators that most effectively demonstrate regional interdependence, how to translate technical findings into accessible public communication, and how to build the data communication infrastructure that makes regional research a continuous public understanding resource rather than a periodic technical publication.
Selecting the Right Regional Indicators
 The selection of regional indicators for public communication purposes is not the same as the selection of technical performance measures for program management purposes. Technical performance measures are selected for their analytical validity and their sensitivity to the program interventions they are designed to assess. Public communication indicators are selected for their ability to demonstrate regional interdependence, their connection to the daily life concerns that motivate public engagement, and their accessibility to non-specialist audiences without extensive explanation. The best public communication indicators are those that satisfy both purposes, providing analytically valid measurements of regional conditions while also clearly demonstrating the regional dimensions of those conditions that make regional coordination necessary.
Cross-jurisdictional data that demonstrates interdependence is the most powerful category of regional indicator for public communication, because it shows specifically how conditions in one jurisdiction affect conditions in other jurisdictions in ways that no single local government can manage on its own. Commute flow data that shows what proportion of the workforce of each major employment center in the region lives outside the jurisdiction in which they work, and what proportion crosses multiple jurisdictional boundaries during their commute, demonstrates the regional transportation interdependence that no amount of local transportation planning can address without regional coordination. Watershed data that shows how land use and development in upstream jurisdictions affects water quality in downstream jurisdictions, demonstrates the environmental interdependence that requires regional rather than local regulatory approaches.
Before-and-after regional coordination data that shows how specific regional conditions changed as a result of specific regional coordination investments or regional policy decisions, provides the most compelling evidence for regional coordination’s value because it demonstrates actual outcomes rather than projected benefits. A regional transportation plan that can document the specific corridor conditions before and after a coordinated regional investment, showing measured changes in congestion, transit ridership, or air quality attributable to the regional investment, has a before-and-after data story that is far more compelling for public communication purposes than projected benefits that have not yet been realized.
Peer region comparison data that shows how the region’s transportation conditions, housing affordability, environmental quality, or economic competitiveness compare with those of peer metropolitan regions, provides the competitive context that motivates public engagement with regional planning investments in ways that isolated regional trend data cannot. The metropolitan region whose transportation conditions are worse than those of comparable peer regions, or whose housing affordability has deteriorated more rapidly than peer region averages, has a competitive performance story that resonates with the regional civic pride and the regional competitiveness concerns that motivate community engagement with regional governance.
From Fragmentation to Coordination: Communication Strategies for Councils of Governments, Metropolitan Planning Organizations, and Regional Planning Agencies
This article is part of our series on strategic communication for Councils of Governments, Metropolitan Planning Organizations, and Regional Planning Agencies. To learn more and to see the parent article, which links to other content just like this, click the button below.
Translating Technical Findings for Public Audiences
The Human Consequence Translation
Technical data findings become publicly meaningful when they are translated into the specific human consequences they represent for the residents whose daily lives those findings describe. A vehicle miles traveled per capita figure becomes meaningful for general audiences when it is translated into the specific hours per year that the average regional commuter spends in their car, the specific dollars per year that the average household spends on transportation, and the specific pounds of air pollutants per year that the average regional driving pattern generates. Each of these translations connects a technical aggregate indicator to a specific human experience that any resident can recognize as personally relevant.
The translation discipline requires finding the specific individual-scale consequence that corresponds to each regional aggregate finding, without distorting the aggregate finding to produce a more dramatic individual-scale number than the aggregate actually supports. A regional air quality monitoring result that exceeds a health-based guideline on a certain number of days per year becomes meaningful for public communication when it is translated into what that exceedance means for the respiratory health of sensitive populations in specific geographic areas, how many additional asthma episodes the exceedance is associated with in those populations, and what it means for the outdoor activity decisions of families with children who are sensitive to air quality. These translations are not fabrications. They are the specific human consequence expressions of aggregate technical findings that make those findings publicly actionable rather than technically available but humanly invisible.
Narrative Data Communication
The most effective data communication for public audiences combines the empirical credibility of quantitative data with the narrative engagement of specific human stories that make data findings personally relatable. A regional data finding about rising housing costs is most compelling for public audiences when it is combined with specific individual or family stories that illustrate what those housing cost trends mean for specific households in specific communities. The housing cost data provides the empirical foundation that prevents the individual story from being dismissed as anecdote. The individual story provides the human engagement that prevents the housing cost data from being experienced as abstract statistics.
Narrative data communication requires the editorial discipline to select the individual stories that most accurately represent the population-level finding that the data describes, rather than the most dramatic stories that the data can be associated with regardless of their representativeness. The family whose housing situation represents the median impact of regional housing cost trends on families with their income and household characteristics, narrated alongside the regional data that establishes their situation as representative rather than exceptional, is a more credible and more durable public communication story than the extreme case whose dramatic circumstances attract initial attention but that audiences will eventually recognize as unrepresentative.
Building a Regional Indicators Dashboard
A regional indicators dashboard that provides continuous, publicly accessible tracking of a defined set of key regional condition indicators, updated regularly with current data and presented in accessible visual formats, is among the most valuable regional data communication investments that regional councils can make. Unlike periodic data publications that provide a snapshot of regional conditions at the time of publication, a regional indicators dashboard provides the longitudinal tracking that shows how regional conditions are changing over time, allows the public to assess whether regional planning investments are producing the condition improvements they are designed to achieve, and creates the continuous accountability relationship between the regional planning agency and the public that periodic publications cannot sustain.
Dashboard design for non-specialist audiences requires the visual design discipline that makes data trends immediately comprehensible without statistical literacy, including sparkline charts that show multi-year trends in a single compact visual, color coding that signals whether conditions are improving or deteriorating relative to planning goals, and plain-language interpretation that explains what each indicator measures, why it matters, and what the current trend means for regional planning priorities. A dashboard that presents twelve regional condition indicators in a format that any adult can scan in two minutes and understand the key governance implications of, is a regional data communication tool that serves the accountability function without requiring the statistical expertise that most technical data publications demand of their readers.
Geographic specificity in regional indicators, showing how specific indicators vary across different parts of the regional planning area rather than only providing service-area-wide aggregate values, gives community members the locally relevant data that makes regional indicators personally relevant rather than only regionally interesting. A regional transportation dashboard that shows average commute times by municipality or by transit zone, rather than only the regional average, gives residents the specific data that tells them whether their community’s transportation conditions are better or worse than the regional average and whether they are improving or deteriorating relative to regional trends. This geographic specificity is the data communication investment that most powerfully connects regional indicators to individual community members’ daily lives.
Regional Data as a Public Education Tool
Regional data and regional research can serve a public education function that goes beyond accountability tracking and into the active building of public understanding of the regional interdependencies that make regional coordination necessary. The regional commute flow data that shows how the workforce of every major employment center in the region crosses multiple jurisdictional boundaries, the watershed data that shows how upstream land use affects downstream water quality, and the housing market data that shows how exclusionary zoning in one jurisdiction raises housing costs in adjacent jurisdictions, are all data sets that teach regional interdependence to any audience that engages with them in accessible formats.
Public education data events, including regional data open houses, regional conditions walking or cycling tours that incorporate regional data storytelling about specific places visited, and regional planning simulation games that let participants explore the consequences of different regional planning decisions through interactive data tools, make regional data an active public engagement tool rather than a passive information resource. A regional planning agency that hosts an annual regional conditions open house, inviting the public to explore interactive regional data visualizations with staff facilitators who can explain what the data means and why it matters, is using regional data for public education in ways that data publication alone cannot achieve.
Media engagement with regional data, including regular data briefings for local reporters that provide the regional data context for the local stories they are covering, embeds regional data in local media coverage in ways that reach general audiences through trusted channels rather than requiring those audiences to seek out regional data resources independently. A regional planning agency that provides the transportation reporter covering local congestion stories with the regional travel demand model data that shows how local congestion is connected to regional development patterns, is providing the regional data context that makes local transportation stories regionally comprehensible rather than locally isolated.
School and civic education partnerships that bring regional data and regional planning concepts into school curricula and civic education programs, build the regional planning literacy in younger generations and in civic participants that makes regional governance more democratically engaged over time. A regional council that partners with school districts to develop a regional indicators curriculum unit for high school social studies classes, using regional data to teach regional interdependence and regional planning concepts, is investing in the civic education that builds the next generation of informed regional governance participants.
Research Communication for Regional Planning Rationale
Beyond the ongoing regional indicators that describe current regional conditions, regional planning agencies conduct and commission specific research that provides the analytical foundation for specific regional planning policies and investment decisions. This research, including transportation demand studies, housing needs analyses, economic development assessments, and environmental impact analyses, provides the evidence base for specific regional planning choices that the public has a right to understand and evaluate. Communicating this research to public and official audiences in accessible terms is a transparency obligation that most regional agencies satisfy incompletely, producing research documents that are technically available but not publicly accessible.
Research findings plain-language summaries that extract the key findings and the key governance implications of specific research projects, in formats that non-specialist audiences can read and understand without working through the full technical document, extend the reach of regional research beyond the planning professional audience that technical research documents serve. A housing needs analysis that produces a forty-page technical report for planners and policymakers alongside a four-page plain-language findings summary for general audiences, is research communication that serves both the technical documentation function and the public education function that research communication requires.
Research dissemination through community channels, including presenting research findings at community organization meetings, providing research summaries to local media for coverage, and distributing research plain-language summaries through member government communication channels, gives regional research the community reach that posting research documents on the agency’s website cannot achieve for general audiences who do not seek out regional planning research. The research that is communicated through community channels becomes a public education resource. The research that is only posted to the agency’s website remains a technical archive that public audiences rarely access.
How Data Communication Compares With Narrative Communication
Data and research communication is most effective for building public understanding of regional coordination when it is combined with narrative communication that provides the context and the human meaning that data alone cannot convey. Data establishes the empirical foundation for regional coordination rationale. Narrative provides the human relevance that motivates public engagement with that rationale. The regional transportation dashboard that shows average commute times increasing year over year across the metropolitan area is a compelling data story. The same data combined with a narrative account of how specific commuters’ daily lives are affected by those increasing commute times, and how specific regional transportation investments are designed to reverse the trend, is a complete public communication that combines empirical credibility with human engagement.
The comparison with effective science communication reveals the same lesson that public communication scholars have documented across many domains of technical information: data without narrative reaches the analytically motivated audience but misses the narratively motivated majority. Narrative without data is anecdote. Narrative with data is evidence-based storytelling that serves both the emotional engagement that motivates public interest and the analytical credibility that sustains it under scrutiny. Building the editorial discipline that combines data and narrative effectively is the most important communication skill investment that regional data communication programs require.
Communicating Regional Interdependence Through Everyday Data
The most effective data for building public understanding of regional coordination necessity is data that connects the everyday experience of regional residents to the regional interdependencies that produce that experience. The commute time that a resident experiences every day is shaped by the development decisions of jurisdictions the resident may never visit and whose planning processes the resident has never engaged with. The air quality that the same resident experiences in their neighborhood is shaped by emissions from sources distributed across the regional transportation system and regional industrial land base that no single local government can regulate in isolation. The housing cost that the resident pays is determined by supply and demand dynamics that span the full metropolitan housing market rather than only the jurisdiction in which the resident lives.
Everyday data that makes these regional interdependencies visible, organized around the specific experiences that residents already know from their daily lives, is data that earns the initial audience attention that more abstract regional planning data cannot generate. A regional council that communicates the commute time data most relevant to the specific routes that residents in different communities travel most frequently, that connects current commute time trends to the regional transportation planning investments being made and being deferred, and that shows specifically how commute times in each community compare with regional plan targets, is producing everyday data communication that connects a universally shared daily experience to regional planning governance in terms any commuter can immediately recognize as relevant.
Household-level data translation that converts regional aggregate indicators into the specific annual household-level costs and benefits they represent, including the household transportation cost implications of current regional transportation conditions, the household housing cost implications of regional land use patterns and housing production levels, and the household utility cost implications of regional infrastructure investment decisions, gives residents the personal financial connection to regional planning that aggregate regional statistics do not provide. The region-wide average vehicle miles traveled per capita becomes personally relevant when it is translated into the average household’s annual transportation spending, the average household’s annual transportation time investment, and the specific comparison of those costs with what they would be if the regional transportation plan achieved its mode shift and congestion reduction targets.
Data storytelling that uses locally specific data to illustrate regional interdependence, including watershed data that shows how a specific upstream development decision affected water quality at a specific downstream recreation site that local residents use, or transportation data that shows how a specific regional freight corridor investment affected delivery costs for small businesses in specific communities along the corridor, connects regional data findings to specific local places and specific local conditions that general audiences can recognize as relevant to their own community experience rather than as abstract regional metrics.
Regional Indicators and Democratic Accountability
Regional indicators serve a democratic accountability function that goes beyond their technical performance management value, providing the empirical basis on which citizens can evaluate whether regional planning agencies are managing the shared regional resources and shared regional conditions that regional coordination is supposed to serve effectively. A democracy in which citizens have no access to the performance data that would allow them to evaluate whether public agencies are delivering on their commitments is a democracy in which public accountability is formal but not substantive. Regional indicator communication that provides citizens with accessible, comparable, and honest performance data on the regional conditions that regional planning is responsible for is democratic accountability communication in its most direct form.
Public accountability framing for regional indicators communication that presents performance data explicitly as the public’s evidence for evaluating regional planning performance, rather than as the agency’s demonstration of program competence, gives regional indicator data the accountability orientation that serves democratic governance rather than institutional self-promotion. The regional transportation agency that presents its on-time performance data as what the public needs to know to evaluate whether the transit system is delivering the service reliability it is funded to provide, is framing its performance data as a democratic accountability tool rather than as a public relations asset.
Opposition research robustness for regional indicators means designing indicator systems that are honest enough to be resistant to counter-evidence from critics who have access to the same data the agency is reporting. An agency that reports only the indicators on which it performs well, while avoiding reporting on indicators where performance is poor, is building an indicator communication program that will eventually be challenged by the critics who produce the missing data independently, damaging the agency’s credibility more severely than honest reporting of poor performance would have. A regional indicator program that is designed for complete honesty about performance across all major regional conditions, including those where performance is poor, is a program that is building institutional credibility that selective positive reporting cannot achieve.
Longitudinal indicator accountability that tracks the same indicators consistently over time, allowing the public to see whether regional conditions are improving, stable, or deteriorating across multiple planning cycles, is the most powerful form of democratic accountability that regional indicators can provide. The regional planning agency that has tracked the same set of twelve regional condition indicators for ten consecutive years, and that has published those indicators publicly each year with honest interpretation of what the trends mean for regional planning, is an agency that has demonstrated the institutional commitment to transparent performance accountability that most regional governance institutions aspire to but few achieve consistently over a decade.
Communicating Regional Data About Housing and Equity
 Housing and equity data are among the most important and the most politically sensitive regional indicator categories, because housing market data reveals the consequences of regional planning decisions for household financial security and community stability in ways that make the distributional dimensions of regional planning governance visible and evaluable. Regional housing data that shows how housing costs have changed across different income groups, different racial groups, and different geographic areas of the region, makes the equity dimensions of housing market outcomes quantifiable in ways that political claims about regional equity cannot achieve without data backing.
Displacement tracking data that monitors whether specific lower-income communities and communities of color are experiencing population displacement as a result of regional investment and development activity, provides the accountability measure for regional planning’s anti-displacement commitments that program description alone cannot supply. A regional planning agency that tracks displacement indicators, including rental vacancy rates, median rent levels, homeownership rates, and population composition changes in communities with significant regional investment activity, and that publishes that tracking data alongside its investment announcements, is demonstrating the equity accountability commitment that regional planning’s equity aspirations require.
Opportunity mapping data that shows where regional investments in transportation, environmental quality, educational resources, and economic development are improving conditions for lower-income and historically underserved communities, and where regional investment is falling short of equity goals, provides the equity performance accountability that regional planning’s equity commitment requires beyond rhetorical statements. A regional opportunity map that tracks change in access to jobs, quality schools, parks, and healthy food by census tract over time, showing which communities are gaining and which are losing access to regional opportunities as a result of regional planning decisions and investment patterns, is the equity accountability data communication that makes regional planning equity commitments verifiable rather than aspirational.
Segregation and integration trend data that tracks how residential segregation patterns in the region are changing over time as a result of regional housing planning, fair housing enforcement, and regional investment decisions, provides the most fundamental equity accountability measure for regional planning’s role in shaping who can afford to live where in the metropolitan region. Regional planning agencies that track and publish residential segregation data alongside their housing planning and investment communications are providing the equity transparency that makes regional planning governance accountable for the distributional consequences of the housing market conditions it shapes.
Communication as Democratic Infrastructure
The communication programs that regional collaborative agencies build for their diverse audiences, from the general public with no direct agency relationship to tribal nations with sovereign governmental relationships to rural communities with geographic and cultural barriers to participation, are together the democratic infrastructure through which regional planning governance derives its legitimacy, sustains its political support, and exercises its accountability to the communities it serves. No single communication program serves all of these audiences adequately. The democratic infrastructure of regional governance communication is the sum of the specific programs, the specific relationships, and the specific communication investments that together give every community in the regional planning area the access to regional planning information and the opportunity for regional planning engagement that democratic governance requires.
Regional collaborative agencies that invest in this full democratic infrastructure of regional governance communication, reaching general audiences through trusted community channels, consulting tribal nations through government-to-government protocols, engaging rural communities through the geographic and cultural channels they actually use, and communicating regional data and research in the accessible formats that make regional planning empirically understandable, are agencies that are fulfilling the democratic accountability obligations of regional governance rather than satisfying only the regulatory compliance requirements that define minimum acceptable practice. The difference between these two standards is the difference between regional governance that the communities it serves regard as legitimate and accountable, and regional governance that those communities tolerate as an administrative reality without trusting as a genuine representative institution.
The investment required to build this democratic communication infrastructure is substantial but not unlimited. It requires organizational commitment, sustained staff capacity, and communication program investment at levels that most regional agencies have not historically provided for communication functions. But it is an investment that produces returns in political sustainability, planning quality, and governance legitimacy that far exceed the alternative cost of regional governance that lacks the democratic infrastructure to sustain its mandate through the political cycles, the governance challenges, and the community conflicts that every regional planning agency must navigate over the decades-long time horizon of regional coordination.
Communication Governance and Organizational Accountability
The communication programs that regional collaborative agencies build around their governance responsibilities, whether those programs are oriented toward general public understanding, tribal and rural community engagement, or data-driven civic education, are most effective when they are governed with the same organizational accountability that the agencies apply to their technical planning and program delivery functions. Communication governance that assigns specific staff responsibility for specific communication program outcomes, that measures those outcomes against specific performance standards, and that reports program performance honestly to agency leadership and to the governing board, is organizational accountability for communication quality that most regional agencies have not established at the same level as their accountability for technical program delivery.
Communication quality standards that define what adequate and excellent communication looks like for each major audience type and each major communication program, provide the performance benchmarks that make communication accountability specific and evaluable rather than aspirational. A regional council that has defined specific standards for the quality of member government briefing materials, the quality of tribal consultation process, the quality of rural community engagement formats, and the quality of public data communication, is a council that can assess its communication performance against those standards and can identify specific improvements needed to meet them.
Annual communication program evaluation that assesses each major communication program against its defined quality standards and its defined outcome goals, that identifies the specific programs that are meeting those standards and those that are falling short, and that recommends specific program changes in response to the evaluation findings, provides the organizational learning infrastructure that makes communication program quality improve over time rather than remaining static at the level of initial program design. This annual evaluation should be conducted with the same rigor and the same organizational attention that financial audits and program performance reviews receive, because communication quality is as important to regional governance effectiveness as financial integrity and program delivery quality.
Sustained Communication Investment as Governance Strategy
Regional collaborative agencies that invest in sustained communication programs for the full range of audiences their governance requires, general public, tribal, rural, and data-literate civic audiences alike, are making a governance strategy investment rather than simply a communication program investment. The political sustainability of regional coordination as a governance form depends on the quality of the communication that builds public understanding, civic trust, and democratic legitimacy across the geographic, cultural, and demographic diversity of the communities that regional planning agencies serve. Communication that serves only the urban planning professional and civic activist audience that shows up for regional meetings, while failing to reach the general public, the tribal nations, the rural communities, and the data-skeptical constituencies that also fund and live with regional planning’s consequences, produces regional governance that is technically competent but democratically thin.
The governance strategy case for sustained communication investment is that regional collaborative agencies operate in a political environment where their legitimacy is not guaranteed by their technical planning quality alone, but must be continuously renewed through the public understanding and the civic trust that communication builds over time. An agency whose technical planning is excellent but whose communication is inadequate will find its governance legitimacy challenged by the constituencies whose understanding of and engagement with regional planning governance is insufficient to support the political commitments that regional coordination requires. An agency whose communication investment matches its technical planning investment will find its governance legitimacy reinforced by the constituencies whose understanding and engagement create the political foundation that regional coordination requires.
The long-term return on sustained communication investment in regional governance is not primarily measurable in the short-term metrics of individual communication program performance. It is measurable in the long-term indicators of political sustainability: the durability of regional program funding across political cycles, the resilience of regional coordination in the face of political challenges and intergovernmental conflicts, the depth of public and official understanding that makes regional planning decisions more informed and more democratically legitimate, and the breadth of community engagement that gives regional governance the democratic foundation that its exercise of public authority over shared regional resources requires. These are the governance returns that sustained communication investment is designed to produce, and they are the returns that most regional collaborative agencies have not yet made the sustained communication investment to achieve.
Tying It All Together
Data, research, and regional indicators are the most powerful tools available to regional collaborative agencies for building the public understanding of why regional coordination matters that democratic governance requires. They provide the empirical foundation for the regional governance rationale that neither institutional authority nor political advocacy can substitute for. But their power is realized only through the communication discipline that makes them accessible to the non-specialist audiences whose understanding they are designed to build, that translates technical findings into the human consequences that general audiences can recognize as personally relevant, and that distributes regional data and research through the channels that general audiences actually use rather than only through the technical publication channels that planning professional audiences access.
Regional councils that invest in the data communication infrastructure, the indicator translation disciplines, the narrative data integration, and the community distribution channels that effective regional data communication requires, are building the public understanding infrastructure that makes regional coordination democratically legitimate over the long term. That infrastructure is the civic foundation on which regional planning political support is built and maintained, and it is the investment that most directly serves the democratic accountability function that regional collaborative agencies exercise when they exercise public authority over shared regional resources and shared regional conditions.
Strategic Communication Support for Data Communication Programs
 Developing the regional indicators dashboards, the research plain-language summaries, the narrative data integration disciplines, the community data distribution channels, and the public education data engagement programs that effective regional data communication requires is work that most regional council communication teams have not been resourced or structured to accomplish alongside the technical data management and analytical functions that most regional agencies have built their research programs around.
Stegmeier Consulting Group (SCG) works with regional councils to develop data and research communication programs that are built around the specific regional indicators, the specific research portfolio, and the specific public audience information environment of each agency’s context. SCG’s engagement begins with a data communication audit that assesses how well current regional data and research is being communicated to public and official audiences, identifying the specific translation gaps between what regional data shows and what public audiences understand about regional conditions, and the specific distribution gaps between where regional data is produced and where public audiences encounter it.
From that audit, SCG develops the specific data communication products and programs that address identified gaps, including regional indicators dashboard designs that provide continuous public condition tracking in accessible visual formats, research plain-language summaries that translate key technical findings into public-accessible accountability communication, narrative data integration frameworks that combine regional data with human story communication for public engagement, and community data distribution programs that place regional research findings in the media and community channels that public audiences actually use.
SCG works with regional council data, research, and communication staff to build the cross-functional organizational practices that make data communication effective as an ongoing program rather than as a series of separate data publications, including the editorial workflows that connect research production to communication translation, the data visualization standards that ensure regional indicators are consistently presented in accessible formats, and the community distribution relationships that ensure regional research findings reach public audiences beyond the planning professional community.
Future Trends in Regional Data Communication
Artificial intelligence tools for data visualization and data storytelling are creating new possibilities for regional data communication that scale beyond what manual data communication production can achieve. AI-assisted data visualization that can generate accessible graphic representations of complex regional data relationships, AI-powered data interpretation that can translate technical analytical findings into plain-language public summaries, and AI-generated personalized regional data reports that present regional condition data in terms specifically relevant to individual residents’ locations and daily routines, are all capabilities that the most data-forward regional agencies are beginning to explore for public communication applications.
Open data initiatives that make regional planning data available in machine-readable formats for download and independent analysis by community organizations, journalists, academic researchers, and interested residents, are creating external data communication ecosystems that extend regional data’s public reach beyond what agency-produced communication can achieve. A regional council that publishes its transportation demand model data, its housing needs assessment data, and its regional environmental monitoring data in open, accessible formats, enables the independent analysis and the community-produced data storytelling that multiplies the public understanding impact of regional research well beyond what the agency could produce on its own.
Real-time regional data platforms that provide current regional condition data through publicly accessible applications, including transit real-time performance data, air quality monitoring data, and regional traffic conditions, are giving general public audiences the direct access to regional condition information that makes abstract regional indicators concrete and personally relevant. The commuter who can see real-time regional transit performance data on their phone is experiencing regional transportation planning data in the moment of its most immediate personal relevance, in ways that periodic regional transportation reports cannot provide.
Conclusion
Regional data, research, and regional indicators are the democratic infrastructure of regional planning governance, providing the empirical foundation on which public understanding of regional coordination’s necessity is built and on which public accountability for regional coordination’s performance is exercised. Regional councils that invest in the data communication infrastructure that makes this empirical foundation publicly accessible and publicly meaningful, that translate technical findings into human consequences for general audiences, and that distribute regional research through the community channels that reach those audiences, are making the democratic accountability investment that genuine governance communication requires.
The councils that produce regional data and research primarily for technical documentation and planning professional use, without investing in the translation and the distribution that makes that data and research publicly accessible, are maintaining a research program that serves internal planning purposes without building the external public understanding that regional coordination’s democratic legitimacy requires. Data without communication is institutional knowledge. Data with communication is civic education. The investment in the communication that converts the former into the latter is the investment in democratic regional governance that the most effective regional collaborative agencies make as a matter of institutional priority rather than as a periodic communication supplement.
Stegmeier Consulting Group’s Strategic Approach to Communication Systems
Build regional data communication around accessible indicator translation, narrative integration that connects data findings to human consequences, and community distribution that reaches public audiences through the channels they trust rather than expecting those audiences to seek out technical regional data publications.
Regional councils need to translate data and research into communication that public audiences can understand, connect with, and use. Stegmeier Consulting Group (SCG) helps councils develop data communication programs tailored to their regional indicators, research portfolios, audiences, and information channels. SCG audits existing data communication to identify gaps between what regional research shows and what residents understand, as well as gaps in how findings are distributed across the service area.
Based on this assessment, SCG develops indicator dashboards, plain-language research summaries, narrative data approaches, and community distribution strategies that make regional findings more accessible and relevant. SCG also supports data visualization standards, editorial workflows, and community distribution relationships that sustain effective communication beyond periodic technical reports. The objective is to turn regional data into clear public understanding of regional conditions, coordination needs, and planning outcomes.
Use the form below to connect with our team and explore how strategic communication support can strengthen your council’s data and research communication program.