Mapping for Impact: How Louisville, Kentucky Uses Strategic Communication to Advance Environmental Justice
 Louisville, Kentucky, historic zoning decisions and industrial activity have contributed to stark disparities in air quality, land use, and public health. To confront this, the Louisville Metro Government created a localized Environmental Justice (EJ) Screening and Mapping Tool, designed to visualize environmental risks and social vulnerability down to the neighborhood level. But the real power of this initiative lies not just in its data—but in how that data is communicated.
This case study examines how Louisville’s EJ tool is a model of communication-driven governance, turning environmental data into a shared narrative that empowers residents, aligns city departments, and builds collective ownership of environmental justice goals.
The Initiative: Louisville’s EJ Screening and Mapping Tool
A Communication-Centered Approach
The Louisville Metro Air Pollution Control District (APCD) launched the tool in 2019 to increase public access to environmental risk data. What sets the tool apart is its intentional design for public use—it’s not a back-end policy tool, but a communication platform that brings together:
- Real-time and historical air quality data
- Traffic congestion and industrial zoning maps
- Demographic, income, and public health layers
- Visualizations tailored for non-expert users
Its goal: equip community members, city staff, planners, and nonprofits with a shared understanding of where inequities exist and how to address them.
Communication as a Tool for Equity
1. Data Visualization for Public Understanding
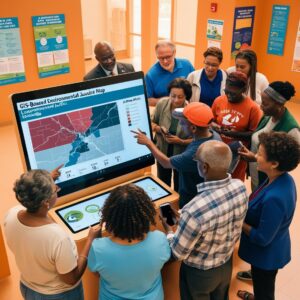
The EJ tool uses a GIS-based web interface that simplifies complex environmental data into intuitive, layered maps. Residents can visually explore:
- Where asthma rates are highest
- Which blocks sit near toxic release sites
- Overlaps of poverty, race, and exposure risk
Instead of spreadsheets or jargon-heavy reports, the public sees color-coded layers that speak visually and instantly to health and justice.
Why It Works:
Louisville’s Environmental Justice (EJ) Tool succeeds because it transforms complex environmental data into accessible, visual formats that invite public understanding and participation. Instead of dense reports filled with technical jargon or hard-to-interpret charts, the tool offers color-coded layers that instantly communicate disparities in air quality, traffic exposure, industrial zoning, and health outcomes like asthma rates. This visualization approach democratizes information—it removes the barrier of needing technical expertise to understand environmental risks.
By empowering residents with intuitive, map-based visuals, the tool fosters a shared vocabulary between citizens and government agencies. People can literally see injustice mapped onto their communities, which transforms data from abstract statistics into compelling, relatable narratives. This visual clarity encourages more informed public dialogue, strengthens civic engagement, and creates a foundation for co-creating solutions between government and residents.
2. Open Access and Self-Advocacy
Unlike internal-facing government dashboards, Louisville’s EJ tool is public-facing and interactive. The site is promoted through:
- City websites and newsletters
- Community briefings and town halls
- Nonprofit workshops and neighborhood association meetings
Community groups use the tool to:
- Prepare public comments for zoning hearings
- Apply for federal EJ grants
- Engage youth in environmental education
Why It Works:
What sets Louisville’s EJ Tool apart is its commitment to public ownership and transparency. Rather than limiting access to internal government analysts or policymakers, the tool is freely accessible to the public and widely promoted through various channels—including city websites, town halls, community meetings, and nonprofit-led workshops.
This open-access approach empowers residents to become active participants in the policymaking process. By arming local organizations, educators, and residents with credible data, the tool helps people advocate for change in ways that are grounded in facts and community experience.
Whether it’s using the data to craft testimony for zoning hearings, apply for federal EJ grants, or teach youth about neighborhood conditions, residents are no longer passive recipients of information—they become informed agents of change. This transparency also builds trust. When communities see that government data is not hidden behind closed doors but rather shared openly and used to shape real outcomes, it deepens their belief in the system’s responsiveness and fairness.
3. Coordinated Messaging Across Departments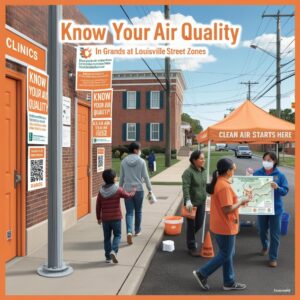
City departments—including Planning & Design Services, Sustainability, Public Health, and Transportation—use the same tool in their outreach. This ensures that all communications around zoning, land use, and infrastructure are:
- Consistent in language and data sources
- Rooted in equity metrics
- Responsive to community input
For example, during a 2022 community rezoning process, the city included an EJ impact slide in every neighborhood presentation to show how proposals aligned with data from the map.
Why It Works:
One of the key strengths of Louisville’s approach is how the EJ tool acts as a unifying reference point across city departments. Planning & Design Services, Sustainability, Public Health, and Transportation all incorporate the same mapping data in their outreach, ensuring consistency in both message and action. This coordination eliminates the confusion that often arises when departments work in silos or rely on conflicting data sources.
During rezoning processes, for instance, city presentations included environmental justice slides directly pulled from the EJ tool, reinforcing that decisions were data-driven and aligned with community well-being. This creates a shared narrative across government agencies—one that is transparent, equity-oriented, and responsive to residents’ lived experiences.
When the public sees that every department is speaking the same language, using the same data, and acknowledging the same environmental burdens, it lends credibility to the city’s efforts. It signals a genuine commitment to change rather than a performative gesture. This alignment also streamlines internal collaboration, making it easier for agencies to work together toward long-term, systemic improvements in environmental health and equity.
4. Community Storytelling and Education
The map is frequently used in community workshops, often led by nonprofits or environmental advocates, who use the tool to teach residents:
- How industrial zoning relates to childhood asthma
- What cumulative burden means in their neighborhood
- Where to advocate for green buffers or air monitoring
Workshops blend personal stories and lived experience with visual data, reinforcing that residents are experts in their own environment.
Why It Works:
At the heart of Louisville’s EJ strategy is the belief that community voices are central to environmental justice. The mapping tool is not just used in isolation but is woven into storytelling workshops and educational programs led by nonprofits, educators, and advocacy groups. These sessions don’t merely show data—they connect it to lived experience.
Residents learn how zoning decisions affect childhood asthma, how proximity to traffic corridors increases health risks, and where they can advocate for mitigation efforts like green buffers. These stories bring depth and humanity to the statistics.
By blending data with narrative, the tool validates local knowledge and reinforces the idea that residents are experts in their own environment. It also fosters intergenerational dialogue, as young people learn from elders and vice versa, cultivating a sense of community ownership over local change efforts. This approach transforms data points into action plans, turning neighborhoods into active participants in shaping healthier, more just futures.
Outreach Campaigns Linked to the Tool
1. Asthma and Air Quality Education
In partnership with the Department of Public Health, the city launched campaigns in zip codes identified by the EJ tool as high-burden for asthma and traffic-related air pollution.
Outreach tactics included:
- Bilingual flyers at clinics and schools
- “Clean Air Champions” program in local elementary schools
- Radio ads featuring neighborhood residents
2. Lead Awareness and Testing
In census tracts flagged for aging infrastructure and child lead risk, the city deployed:
- Home mailers with map screenshots
- Community pop-up events with testing kits
- QR codes linking residents directly to their neighborhood risk level
These campaigns exemplify how mapping and communication go hand-in-hand—data informs outreach, and outreach validates data.
Impact and Results
- 3,500+ tool users since public launch
- Multiple city departments now integrate the EJ map in presentations and reports
- Community use cases include successful advocacy to relocate industrial proposals and secure air quality monitoring investments
- Used as a support tool in federal EJ grant applications by local nonprofits and the city
 Takeaways: Communication Lessons from Louisville’s EJ Tool
Simplicity Unlocks Access
Tools must speak visually and simply—because justice shouldn’t require a degree in GIS.
Data Builds Dialogue
When residents and agencies use the same source of truth, it shifts conversations from denial to collaboration.
Storytelling Completes the Picture
Data only matters when connected to human impact. Louisville’s workshops, youth programs, and media campaigns bring numbers to life.
Conclusion: Communication as a Cornerstone of Environmental Justice
Louisville’s Environmental Justice Screening and Mapping Tool isn’t just a technical product—it’s a public communication platform that connects residents to their environment, policymakers to reality, and all stakeholders to a shared path forward.
By embedding the tool in outreach campaigns, community workshops, and cross-agency messaging, Louisville proves that transparent communication is just as important as the data itself.
For any city looking to advance environmental equity, Louisville’s message is clear: don’t just map injustice—talk about it, visualize it, and invite your community to be part of the solution.
Ready to Elevate Your Agency’s Public Communication?
We understand the unique challenges state and local government agencies face—from complex issues to diverse community needs. Our comprehensive approach can help you transform the way you connect with constituents, improve transparency, and highlight the valuable work your agency does every day.
Interested in learning more? Reach out to us today for a consultation. We’d love to discuss how our services can support your goals and help you build lasting trust with the communities you serve.