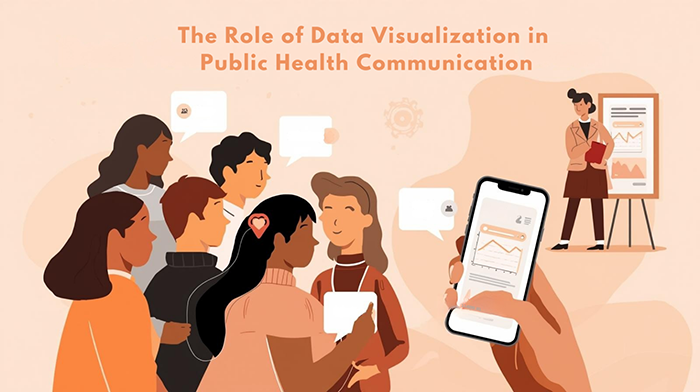
The Role of Data Visualization in Public Health Communication
 Public health departments and health agencies collect more data than ever, but data alone rarely changes behavior. Residents need clear interpretation that helps them understand what a trend means for their daily decisions, their families, and their community. Data visualization helps health authorities and public health organizations turn complex information into something people can absorb quickly, especially when they are stressed, distracted, or reading on a phone.
At the same time, the public has become more skeptical of charts and statistics when they feel confused, selective, or inconsistent. A single misleading graphic can spread rapidly and damage trust. For county or regional health departments, the challenge is not just creating visuals. It is building a visualization approach that is accurate, easy to understand, consistent across channels, and designed to support action.
Data visualization is not only a design choice. It is part of the communication system that helps residents interpret risk, understand program impact, and follow guidance. When a public health organization uses visuals well, it can reduce confusion, shorten decision time, and improve follow-through. When visuals are poorly designed, they can increase misinformation, trigger unnecessary alarm, or cause residents to dismiss the message entirely.
This article outlines an evergreen, practical framework for using data visualization in public health communication. It focuses on how to choose the right visual, how to protect trust, how to design for accessibility, and how to integrate visuals into multi-channel messaging without overwhelming staff capacity.
Why Data Visualization Matters More Than Ever for Health Communication
Public health communication is competing in a crowded environment where residents skim more than they read. That reality makes visual interpretation essential. A well-designed chart can communicate a trend in seconds, while a paragraph can be ignored or misunderstood. For health agencies, this matters because many public-facing decisions depend on fast understanding, such as whether to get a vaccine, seek testing, attend a clinic, avoid exposure, or follow seasonal prevention guidance.
Visualization also helps public health departments communicate uncertainty more responsibly. When evidence evolves, a clear visual can show direction and context, such as whether cases are rising or falling, whether hospitalization pressure is stable, or whether a local outbreak is limited to a specific setting. This can reduce rumor cycles because residents can see the pattern rather than relying on dramatic headlines or partial screenshots.
Another reason visualization matters is that modern public health work is increasingly program-based and outcome-focused. Public health organizations need to show what services are doing, who is being reached, and where gaps remain. Residents, partners, and policymakers all ask for proof, but proof has to be understandable. A dashboard that only technical audiences can interpret will not build public trust. A simple, well-framed graphic can help explain progress without exaggeration or defensiveness.
Visualization also supports internal alignment. When staff across a health authority can see the same indicators presented consistently, internal conversations become faster and more focused. Teams can reduce debates about what the data means and instead align on what action is needed. That internal clarity often improves public messaging because it reduces conflicting statements and inconsistent language across programs.
There is also a more human reason visualization matters. Many residents do not have the time or comfort level to interpret complex health statistics. They still deserve clear information. A public health department that designs visuals for real audiences, including mobile users, non-technical readers, and multilingual communities, lowers barriers to understanding. That is not only good communication. It is a practical equity strategy.
Finally, visualization can help protect credibility when used with restraint. In a crisis, too many charts can look like noise. In routine programming, overly polished visuals can look like marketing. The strongest public health organizations use visualization to clarify a decision or explain an outcome, not to impress. That approach makes visuals feel trustworthy because they serve the reader.
From Data to Action: Effective Communication Strategies for Public Health Agencies
This article is part of our series on strategic communication for state and local government Public Health Agencies. To learn more and to see the parent article, which links to other content just like this, click the button below.
From Data to Meaning, What a Visual Must Do Before It Looks Good
Many health agencies begin visualization work by selecting a chart type, then trying to fit the message into it. A stronger approach starts with the meaning residents need to understand. Meaning is the interpretation that connects the data to a practical decision. Without that interpretation, a chart becomes a display of numbers instead of a tool that supports clear action.
For public health departments, meaning becomes clearer when the visual is tied to a specific purpose. A visualization might help residents understand current risk and choose protective actions. It might encourage participation in a prevention program. It might explain why guidance changed, or show progress in services and maintain confidence. Even when the underlying data is similar, each purpose calls for a different emphasis and a different level of context.
Meaning also depends on choosing measures residents can interpret, or translating technical measures into plain language. Rates, confidence intervals, and per-capita calculations can be essential for accuracy, but most people do not absorb them intuitively. Public health organizations can use these measures responsibly by pairing them with a clear takeaway. If a chart shows a rate, the supporting text should explain what that rate means in everyday terms and how it affects the recommended action.
Scope is another core part of meaning. Residents need to understand what geography the visual represents, what time period it covers, and which population it describes. When those cues are missing, people may assume a county-level chart applies to their neighborhood, or they may misread a short-term spike as a long-term trend. Those misunderstandings can lead to unnecessary fear, or to complacency that delays action.
Comparisons also shape meaning, and they require careful handling. Many visuals persuade because they compare one period to another, or one location to another. Comparisons can improve clarity, but they can also mislead when the baseline is unclear or selectively chosen. Health authorities protect trust by labeling comparisons plainly and using consistent, defensible reference points that do not exaggerate change.
A visual also needs narrative support. In public health communication, a chart should almost always be paired with a short caption that states the key takeaway and the practical implication. Residents tend to remember the caption more than the axes. The visual should reinforce the takeaway rather than forcing the viewer to infer it.
Finally, meaning includes emotional usability. A visualization can unintentionally heighten anxiety if it feels dramatic or if it lacks context about what residents should do. Health agencies can prevent alarm by pairing visuals with clear action steps or clear guidance on what to watch for. When residents see a trend, they should also see a practical next step that fits the level of risk.
Match the Visual Type to the Communication Purpose
Public health departments often default to familiar chart types, then try to force the message into the chart. A more effective approach is to select the visual form that naturally supports the meaning you need residents to take away. When health agencies choose the right visual for the purpose, the graphic becomes easier to understand, easier to share, and less likely to be misinterpreted.
A purpose-driven approach also supports consistency. When public health organizations adopt a small set of visual standards, staff can work faster and residents learn what to expect. That familiarity reduces the chance that residents interpret a new chart style as a new message or a change in seriousness.
-
Trend visuals. When the goal is to show change over time, residents typically benefit from a simple trend visual that keeps the time window clear and the takeaway obvious. Trend visuals are especially useful for seasonal illness updates, environmental exposure changes, and program utilization patterns, because residents can quickly see whether something is rising, stable, or declining.
-
Comparison visuals. When the goal is to compare groups, locations, or time periods, comparisons work best when they are limited and clearly labeled. For a county or regional health department, the most useful comparisons usually highlight only differences that change decisions, such as where targeted access is needed or which groups face higher risk and need a specific preventive step.
-
Distribution and proportion visuals. When the goal is to show how a total is divided, these visuals can support clarity around service demand, appointment availability, or resource allocation. They work best when paired with a short caption that explains why the distribution matters and what decision it supports.
-
Maps. Maps are powerful for scope and location-based meaning, but they carry higher risk for misunderstanding. Health agencies can use maps responsibly by labeling geography clearly, explaining what the map does and does not show, and adding a plain language takeaway that prevents incorrect assumptions.
-
Flow visuals and simple diagrams. When the goal is to explain a process, a diagram that shows a step-by-step path can be more useful than a chart. Programs involving eligibility checks, appointment scheduling, follow-up timing, or what to do after exposure often see better follow-through when residents can visualize what happens next.
Build Visuals for Plain Language, Not for Technical Audiences
 A visualization can be statistically correct and still fail as public communication. Many residents do not read axes carefully, do not interpret rates intuitively, and do not have the time to decode dense legends. Health agencies can protect comprehension by treating plain language as a design requirement, not a writing step added at the end.
Plain language in visualization starts with the headline and caption. A public health department should write the headline as the takeaway, not as a description of the dataset. Residents should not have to infer the meaning. The caption should reinforce the takeaway and connect it to a practical implication. When a graphic has no clear takeaway, viewers fill the gap with their own interpretation, and those interpretations spread through conversations and screenshots.
Labels matter as much as the chart. Health authorities can reduce cognitive load by using everyday words for measures when possible, and by defining unavoidable technical terms in short phrases near the visual. If the graphic uses a rate, the caption can explain what the rate means in plain terms. If the graphic uses a rolling average, the caption can explain that it smooths daily fluctuations so the trend is easier to see.
Scale choices also shape public understanding. A chart can look dramatic or calm depending on how the axis is scaled and how the time window is chosen. Public health organizations should use scale choices that are honest and consistent across updates, especially during periods of heightened attention. When residents notice that a chart looks different from the last one, they may assume manipulation even when none exists. Consistent conventions, paired with an update note when something changes, reduce that suspicion.
Context is another essential design element. A trend line without context can cause fear during a short spike or complacency during a lull. Health agencies can add context through brief reference points that are meaningful, such as a typical seasonal range, a service capacity threshold, or a reminder that a metric lags behind real-time conditions. Context can also be provided through a short sentence that keeps attention focused on practical decisions rather than speculation.
Public health departments should also design for the most common viewing environment, which is mobile. Mobile viewing reduces patience for fine print and increases the chance that content will be shared without surrounding explanation. A health authority can improve mobile usability by keeping visuals clean, avoiding dense legends, and ensuring the main message is understandable even if the viewer only reads the headline and the first line of the caption.
To help health agencies apply plain language consistently, it can be useful to standardize a short caption pattern. A simple pattern is a takeaway sentence followed by a practical implication sentence. Over time, residents learn how to read updates quickly, and staff can produce consistent visuals without extensive rewriting.
Preventing Misinterpretation, Common Visualization Pitfalls That Damage Trust
Public health departments can lose trust quickly when a chart is easy to misread, even if the underlying data is valid. Many residents do not examine a graphic like an analyst. They absorb the overall shape, the headline, and any bold callouts. If the visual implies a conclusion the data does not support, the message can spread faster than corrections, especially when screenshots circulate without context.
Health agencies can protect trust by designing for how visuals will actually be consumed. That means making scope and timeframe unmistakable, keeping comparisons defensible and consistent, and pairing each visual with a plain language takeaway and a practical implication.
-
Unclear labeling. When axes are not labeled plainly, when units are missing, or when the timeframe is unclear, residents fill in the gaps. A short note should explain moving averages, cumulative totals, or per-capita measures when they are used.
-
Inconsistent scales across updates. If a series changes y-axis ranges or time windows, the same trend can look dramatically different. Consistent conventions reduce suspicion. If a scale must change, include a simple note that explains why.
-
Too many messages in one visual. Dense graphics that combine multiple metrics can overwhelm the viewer and reduce comprehension. A more effective approach is one visual for one decision, with a small set of separate visuals if additional context is needed.
-
Misleading baselines or comparisons. Comparisons can clarify or distort depending on the reference point. Health authorities protect credibility by choosing baselines that match the decision and by labeling comparisons plainly and consistently.
-
Implying causation. Visuals can suggest that one factor caused another when the relationship is not established, especially when two lines are placed together without explanation. Captions should be explicit about what the chart shows and what it does not prove.
-
Maps that imply false precision. Maps feel authoritative and can imply precision the data does not support. Label the geographic unit clearly, note aggregation or privacy protections when relevant, and include a plain language takeaway that prevents incorrect assumptions.
-
Alarm without an action pathway. Visuals can heighten anxiety when they emphasize dramatic change without clarifying what residents should do. Pair key visuals with clear guidance, what to watch for, and a verification route that reduces rumor-driven sharing.
Accessibility and Equity in Visualization, Making Charts Usable for Real Communities
A visualization that works for a technical audience can still fail for the public. Health agencies serve residents with different literacy levels, different comfort with numbers, different languages, and different levels of access to digital tools. Accessibility is not only a design standard. It is a practical equity strategy that helps more residents interpret health information correctly.
Mobile usability is a central requirement. Many residents will view a chart on a phone, often in a social post or as an embedded image in a text thread. Public health departments improve comprehension when visuals remain readable at small sizes. That usually means using short labels, strong spacing, and avoiding dense legends. When small details matter, the visual should be paired with a short caption that carries the key takeaway.
Language access also affects visualization success. Translating a caption is not enough if the chart itself uses English-only labels and abbreviations. Health authorities can improve usability by avoiding abbreviations, using universally understood terms, and designing visuals so label translation is feasible. Public health organizations can also provide language-specific versions of key visuals for high-importance topics, particularly when the visual is intended to drive behavior change or service utilization.
Numeracy differences matter as well. Many residents understand higher and lower more easily than they understand rates and ratios. That does not mean public health departments should avoid rates. It means they should interpret rates clearly. Captions should explain what the metric means and why it matters. When possible, agencies can use trend direction with a clear time window and a plain language summary of what the change implies.
Equity also involves what data is shown and how it is framed. Public health organizations may need to show disparities by neighborhood, race, ethnicity, age, or other factors to guide resources and communicate impact. These visuals must be handled with care to avoid stigmatizing communities. Health agencies can reduce that risk by framing disparities in terms of structural factors and access barriers, and by pairing the visual with information about resources and interventions.
Accessibility also includes disability considerations. Some residents rely on screen readers, some require larger text, and some benefit from simplified visuals. Public health departments can improve accessibility by providing alternative text descriptions for key visuals on websites, using clear headings and captions, and ensuring that meaning is not carried only by visual elements. When possible, agencies can provide a short text summary that states the takeaway in plain language.
When health agencies build accessibility into their visualization approach, they improve trust. Residents feel included rather than talked over. Partners are more likely to share. Staff are less likely to spend time correcting misunderstandings. Over time, accessible visualization becomes part of a communication system that supports stronger public health outcomes.
Visuals as Part of a Communication System, Not Standalone Graphics
Public health organizations get the most value from data visualization when visuals are treated as part of a larger communication system. A chart on its own rarely answers every question a resident has, and it rarely travels with full context. When health agencies plan how a visual will be introduced, interpreted, and reinforced across channels, the graphic becomes more useful and less likely to be misunderstood.
A system approach starts with a consistent message spine. The spine is a small set of sentences that state the takeaway, the implication, and the recommended action. The visual should support that spine, not compete with it. When the spine is consistent, the same visual can be used on a website, in a social post, in a partner newsletter, and in a briefing, while the caption remains stable. This consistency helps residents recognize the meaning even if they see only a screenshot.
Health authorities also benefit from maintaining a clear source of truth. Many visuals circulate on social media without a link, and older graphics can remain in circulation after conditions change. A public health department can reduce confusion by maintaining a landing page where the most current visuals live, along with updating timestamps and plain-language summaries. When residents can verify quickly, trust improves and rumor cycles slow down.
Another system consideration is version control. Public health departments often update visuals as new data arrives, but they may not update every channel at the same time. That can create apparent contradictions. Health agencies can reduce this by updating the source page first, then pushing the updated visual to other channels with consistent labeling. A simple practice, such as including a date on the visual and a matching updated-on line on the source page, can prevent residents from mistaking an old chart for a current one.
A visualization system also needs internal alignment. Staff should understand what a graphic is meant to communicate and how to explain it in plain language. If internal teams interpret the same chart differently, the public will hear mixed messages. Health authorities can prevent that by pairing key visuals with a short internal brief that states the takeaway, likely questions, and the approved phrasing for describing the trend.
Visuals also work best when they are mapped to the resident journey. Many residents need different information at different moments. A risk trend chart may help with awareness, but a process diagram may be needed for follow-through. A program impact chart may be useful for maintaining confidence, but a location map may be needed for access. When public health organizations match visuals to the moment of decision, the communication becomes more effective and less overwhelming.
Finally, a system approach helps prevent overuse. During high-attention periods, agencies can feel pressured to publish frequent charts. Too many visuals can cause residents to disengage. A public health department can protect attention by publishing visuals that answer the questions residents are actually asking, and by using consistent templates that make updates easy to recognize and interpret.
Develop a Small Set of Standard Visual Templates
Health agencies often improve clarity by limiting the number of visual styles they use for public communication. A small set of templates makes visuals easier to read and easier to trust because residents see the same structure repeatedly. Templates also reduce staff workload, because teams can update a known format rather than redesigning each time.
Standard templates might include a trend update chart, a map for scope or service access, a simple process diagram, and a basic program impact graphic. Each template should use consistent labeling and a caption pattern that states the takeaway and the practical implication. When the template is stable, the meaning is more stable as well.
Pair Every Key Visual With a Plain-Language Caption and a Practical Next Step
Captions are where meaning becomes explicit. A public health organization should treat the caption as the primary communication tool and the visual as support. The caption should state what the chart shows, why it matters, and what residents should do with the information.
A practical next step prevents anxiety. If the visual is informational only, the caption should say that clearly and explain what residents should watch for. When residents see change in a trend, they should also see a clear action pathway or a clear expectation.
Using Visualization to Support Behavior Change, Not Only Awareness
Visualization is often used to inform, but it can also be used to enable behavior change. Public health departments can design visuals that make the desired action feel simpler, more relevant, and more achievable. This is especially important for prevention programs where residents may already feel overwhelmed, skeptical, or constrained by time and access.
A behavior-change visual often works best when it reduces friction. A step-by-step diagram that shows what to do after a potential exposure can be more effective than a chart of case counts. A timeline graphic that shows when to schedule a screening, what to expect, and what happens next can reduce drop-off. A map that highlights convenient service locations and hours can be more useful than a general reminder to seek care. In these cases, the visual is guiding a decision.
Health agencies can also use visualization to make invisible benefits more tangible. Prevention often fails because the benefit is delayed and the risk feels abstract. A visual can show how early action reduces escalation, or how small changes compound over time. The goal is to translate, not exaggerate, and to keep the takeaway tied to what residents can do.
Visualization can also address common misunderstandings. A public health organization can use a simple graphic to clarify what symptoms require urgent care, how eligibility works, or what a test result means. These visuals are most effective when they are designed for mobile, written in plain language, and shared consistently across channels.
Behavior-change visuals can reinforce positive norms when they stay practical. When residents believe preventive behavior is common and supported, follow-through rises. Health authorities can highlight participation trends or community milestones in a way that feels informative rather than celebratory marketing, keeping the emphasis on practical value such as easier access and reduced disruption.
Behavior-change visuals also need equity considerations. If a graphic suggests actions that are not realistic for many residents, it can feel out of touch and reduce trust. Public health departments protect credibility by showing multiple access routes, naming support resources, and acknowledging constraints without judgment.
Prioritize How-To Visuals for High-Friction Programs
Health agencies should consider using visuals most heavily where residents commonly get stuck. Programs that involve multiple steps, documentation, scheduling, or follow-up often benefit from a clear diagram or timeline. These visuals reduce confusion and reduce staff burden by preventing avoidable questions.
When a health department identifies the points where residents abandon a process, it can design a small set of how-to visuals that directly address those friction points. Over time, these visuals become reusable assets that improve follow-through across multiple programs.
Use Visuals to Reinforce the Message Spine Across Channels
Behavior change requires repetition. A public health department can use a consistent visual element, such as a repeated diagram format or a consistent timeline style, to reinforce the same message spine across web, print, and social. When residents see the same logic repeatedly, the desired action becomes easier to remember and more likely to occur.
This approach also supports partner sharing. When partners receive a stable visual and a stable caption, they can amplify the message without rewriting, and the meaning is more likely to survive screenshots and summaries.
Promoting Long-Term Public Health Outcomes Through Communication
Data visualization supports long-term public health outcomes when it helps residents understand trends, interpret risk, and take action with confidence. Public health departments and health agencies do not benefit from visuals that simply display information. They benefit from visuals that reduce confusion, support better decisions, and reinforce prevention behaviors over time.
Long-term outcomes improve when health authorities use consistent visual patterns that residents can learn. When a public health organization repeats the same structure for trend updates, service access maps, and program timelines, the public becomes more comfortable interpreting information quickly. That familiarity reduces reliance on rumor, partial screenshots, or misread charts. It also supports faster community response when conditions change.
Visualization strengthens long-term outcomes when it is paired with clear plain-language interpretation. Many residents will remember the caption more than the chart, and they will share the takeaway more than the data itself. Health agencies improve follow-through when each visual states what the data means and what residents should do next, especially for prevention programs that require scheduling, follow-up, or multiple steps.
Equity outcomes improve when visualization is designed for real audiences. That includes mobile readability, language access, simple labeling, and alternative text descriptions that make key takeaways accessible to residents who use assistive technology. Public health organizations also support equity when they frame disparity visuals responsibly and pair those visuals with information about resources and interventions.
Visualization also supports organizational learning. When health departments track which visuals are misunderstood, which generate questions, and which drive program participation, they can refine templates over time. This creates a stronger communication system, reduces staff rework, and improves consistency across channels and partners.
Over time, data visualization becomes part of public health readiness. It helps residents recognize patterns, understand why guidance shifts, and follow recommended actions with less hesitation. When used consistently and responsibly, visualization builds confidence in the organization and supports healthier behaviors across seasons and programs.
Strategic Communication Support for Your Health Agency
 Health agencies often have strong data, but they face familiar challenges when turning that data into public-facing visuals. Public health departments must balance accuracy with readability, protect trust while communicating uncertainty, and maintain consistency across channels where visuals are shared without context. They also need internal alignment so staff and partners explain visuals the same way, and they need workflows that make updates sustainable.
That is why agencies often choose to partner with an external resource like Stegmeier Consulting Group (SCG) to strengthen communication systems. An outside partner can help public health organizations build a visualization approach that fits their communication goals and operational capacity, including template standards, caption patterns, accessibility practices, and review workflows that protect clarity and trust. This support can also include developing a source-of-truth structure that keeps visuals current and reduces confusion when older graphics circulate.
SCG supports health authorities by helping teams connect visuals to the resident journey and the decisions residents need to make. That often means clarifying the message spine for key indicators, designing channel-ready versions that preserve meaning, and establishing simple governance so updates are consistent across programs and partners. When the system is clear, teams can move faster with fewer errors, and residents can interpret information with more confidence.
A visualization system does not replace community engagement or service delivery. It strengthens them by making information easier to understand, easier to trust, and easier to act on.
Conclusion
Data visualization is one of the most powerful tools public health departments have for turning complex information into understandable guidance. It works best when visuals are designed for meaning, paired with plain-language interpretation, and integrated into a consistent communication system.
When health agencies choose visual types that match purpose, avoid misinterpretation pitfalls, and design for accessibility, residents are more likely to understand risk, follow guidance, and engage with prevention programs. Templates, message spines, and clear captions reduce rework and improve consistency across channels and partners. Over time, responsible visualization strengthens trust and supports better long-term public health outcomes.
SCG’s Strategic Approach to Communication Systems
Align your agency’s messaging, processes, and public engagement strategies
Agencies that communicate effectively build stronger trust with staff, stakeholders, and the public. Whether you are improving health communication campaigns, strengthening internal workflows, or aligning agency-wide messaging, SCG can help you develop a communication system that supports consistent decision-making and long-term organizational success.
Use the form below to connect with our team and explore how a strategic communication framework can elevate your agency’s impact.